使用Python对公交GPS数据进行分析
简介
本篇将使用梧州公交49路3月的GPS数据(已经过脱敏处理)作为案例展示如何使用Python+TransBigData处理公交GPS数据。
关于TransBigData
TransBigData工具针对时空大数据处理而开发,依托于GeoPandas。TransBigData集成了交通时空大数据处理过程中常用的方法。包括栅格化、数据质量分析、数据预处理、数据集计、轨迹分析、GIS处理、地图底图加载、坐标与距离计算、数据可视化等通用方法。TransBigData也针对出租车GPS数据、共享单车数据、公交GPS数据等多种常见交通时空大数据提供了快速简洁的处理方法。
前期准备
安装TransBigData
在安装TransBigData之前,请确保已经安装了可用的geopandas包:https://geopandas.org/index.html 如果你已经安装了geopandas,则直接在命令提示符中运行下面代码即可安装
pip install -U transbigdata
SQL Data To CSV
使用SQL语句在数据库中查询数据,并使用DBeaver等工具导出CSV。
以梧州公交使用的蓝泰源系统为例
SELECT Id, GprsId, OnboardId as VehicleId, OccurTime as GPSDateTime, Latitude as lat, Longitude as lon, Velocity, Angle, Height, BusState, NextStopNo, EngineTemp, BusTemp, RunKm, GprsSignal, ToNextStopDistance, ToNextStopTime, LineFixedId, BusFixedId, NextStopFixedId, ServerTime
FROM GpsDB.dbo.T_R_GpsCoord_Histroy
WHERE GprsId = 491
AND OccurTime BETWEEN '2023-03-01' AND '2023-03-31'
需要注意的是,为对齐TransBigData需要的字段,需把自编号、定位时间、经纬度等分别重命名为VehicleId、GPSDateTime、lat、lon
线路站点的shp文件
通过QGIS、ArcGIS等GIS系统作图获得,不在此篇幅里展开讲述。
数据分析
导入Python包
#导入TransBigData包
import transbigdata as tbd
#导入数据处理包
import pandas as pd
import geopandas as gpd
读取数据
读取GPS数据
BUS_GPS= pd.read_csv(r'./data/T_R_GpsCoord_Histroy.csv')
#时间转换为datetime格式
BUS_GPS['GPSDateTime'] = pd.to_datetime(BUS_GPS['GPSDateTime'])
BUS_GPS
| Id | GprsId | VehicleId | GPSDateTime | lat | lon | Velocity | Angle | Height | BusState | ... | EngineTemp | BusTemp | RunKm | GprsSignal | ToNextStopDistance | ToNextStopTime | LineFixedId | BusFixedId | NextStopFixedId | ServerTime | |
|---|---|---|---|---|---|---|---|---|---|---|---|---|---|---|---|---|---|---|---|---|---|
| 0 | 1732241895 | 491 | 507 | 2023-03-01 22:08:38.687 | 23.481110 | 111.263417 | 0 | 278 | 0 | 131 | ... | 0 | 0 | 288221 | 23 | 6 | 0 | 1 | 4752 | 17413 | 2023-03-01 22:08:38.920 |
| 1 | 1732241897 | 491 | 515 | 2023-03-01 22:08:38.223 | 23.475277 | 111.294277 | 0 | 104 | 0 | 5 | ... | 0 | 0 | 214161 | 31 | 1 | 0 | 1 | 4760 | 17362 | 2023-03-01 22:08:39.520 |
| 2 | 1732241899 | 491 | 517 | 2023-03-01 22:05:48.297 | 23.416417 | 111.239943 | 39 | 212 | 0 | 3 | ... | 0 | 0 | 282570 | 14 | 0 | 0 | 1 | 4762 | 17423 | 2023-03-01 22:08:39.523 |
| 3 | 1732242119 | 491 | 517 | 2023-03-01 22:05:48.277 | 23.416333 | 111.239860 | 39 | 212 | 0 | 3 | ... | 0 | 0 | 282570 | 14 | 0 | 0 | 1 | 4762 | 17423 | 2023-03-01 22:08:42.520 |
| 4 | 1732242134 | 491 | 682 | 2023-03-01 22:08:48.580 | 23.464833 | 111.255555 | 0 | 308 | 0 | 5 | ... | 0 | 0 | 214238 | 25 | 2 | 0 | 1 | 5093 | 17352 | 2023-03-01 22:08:43.820 |
| ... | ... | ... | ... | ... | ... | ... | ... | ... | ... | ... | ... | ... | ... | ... | ... | ... | ... | ... | ... | ... | ... |
| 1626123 | 1754532507 | 491 | 526 | 2023-03-31 16:00:29.597 | 23.464888 | 111.255027 | 0 | 0 | 0 | 33 | ... | 0 | 0 | 146514 | 0 | 0 | 0 | 1 | 4771 | 17340 | 2023-04-01 09:41:18.087 |
| 1626124 | 1754532718 | 491 | 526 | 2023-03-31 16:00:44.637 | 23.464888 | 111.255027 | 0 | 0 | 0 | 33 | ... | 0 | 0 | 146514 | 0 | 0 | 0 | 1 | 4771 | 17340 | 2023-04-01 09:41:21.083 |
| 1626125 | 1754533413 | 491 | 526 | 2023-03-31 16:00:59.513 | 23.464888 | 111.255027 | 0 | 0 | 0 | 33 | ... | 0 | 0 | 146514 | 0 | 0 | 0 | 1 | 4771 | 17340 | 2023-04-01 09:41:23.990 |
| 1626126 | 1754537188 | 491 | 526 | 2023-03-31 16:01:14.543 | 23.464888 | 111.255027 | 0 | 0 | 0 | 33 | ... | 0 | 0 | 146514 | 0 | 0 | 0 | 1 | 4771 | 17340 | 2023-04-01 09:41:26.997 |
| 1626127 | 1754537272 | 491 | 526 | 2023-03-31 16:01:29.580 | 23.464888 | 111.255027 | 0 | 0 | 0 | 33 | ... | 0 | 0 | 146514 | 0 | 0 | 0 | 1 | 4771 | 17340 | 2023-04-01 09:41:29.990 |
读取线路数据
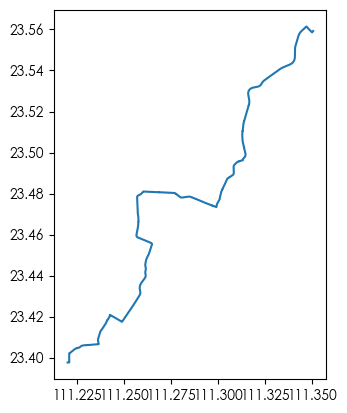
linegdf = gpd.GeoDataFrame.from_file(r'./data/shp/49路.shp',encoding='utf-8')
line = linegdf.iloc[:1].copy()
line.plot()
读取站点数据
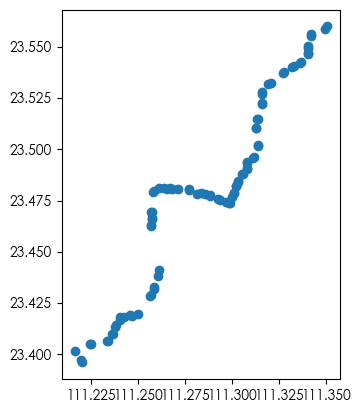
stop = gpd.GeoDataFrame.from_file(r'./data/shp/49路站点.shp',encoding = 'utf-8')
stop = stop[stop['gprsId'] == 491]
stop.plot()
到离站信息匹配
arriveinfo = tbd.busgps_arriveinfo(BUS_GPS,line,stop)
arriveinfo
| arrivetime | leavetime | stopname | VehicleId | |
|---|---|---|---|---|
| 0 | 2023-03-02 08:24:38.350 | 2023-03-02 08:26:08.350 | 盈洋家具广场 | 0 |
| 0 | 2023-03-02 09:22:06.350 | 2023-03-02 09:23:51.350 | 盈洋家具广场 | 1 |
| 0 | 2023-03-02 10:37:51.350 | 2023-03-02 10:39:06.350 | 盈洋家具广场 | 2 |
| 0 | 2023-03-06 09:40:23.350 | 2023-03-06 09:41:29.350 | 龙腾金院东 | 3 |
| 0 | 2023-03-06 09:41:32.350 | 2023-03-06 09:43:38.350 | 梧州南站 | 3 |
| ... | ... | ... | ... | ... |
| 0 | 2023-03-27 09:17:07.350 | 2023-03-27 09:18:18.350 | 新兴三路东(梧州农信社) | 1334 |
| 0 | 2023-03-27 09:13:37.350 | 2023-03-27 09:15:18.350 | 大塘 | 1334 |
| 0 | 2023-03-27 09:11:18.350 | 2023-03-27 09:13:00.350 | 四中 | 1334 |
| 0 | 2023-03-27 09:10:43.350 | 2023-03-27 09:11:06.350 | 太阳广场 | 1334 |
| 0 | 2023-03-14 06:15:59.350 | 2023-03-14 06:51:02.350 | 高新园区一路口 | 1335 |
单程耗时
根据上面得到的arriveinfo计算单程旅行时间。给出公交线路的起点和终点站名称,tbd.busgps_onewaytime可以计算出两站之间的旅行时间。
onewaytime = tbd.busgps_onewaytime(arriveinfo,
                                   start = '梧州南站',
                                   end = '旺甫',col = ['VehicleId','stopname', 'arrivetime', 'leavetime'])
onewaytime
| time | stopname | VehicleId | time1 | stopname1 | VehicleId1 | duration | shour | direction | |
|---|---|---|---|---|---|---|---|---|---|
| 0 | 2023-03-06 10:29:42.350 | 梧州南站 | 4 | 2023-03-06 11:45:40.350 | 旺甫 | 4.0 | 4558.0 | 10 | 梧州南站-旺甫 |
| 0 | 2023-03-06 16:31:37.350 | 梧州南站 | 5 | 2023-03-06 17:52:16.350 | 旺甫 | 5.0 | 4839.0 | 16 | 梧州南站-旺甫 |
| 0 | 2023-03-08 09:00:12.350 | 梧州南站 | 11 | 2023-03-08 10:18:28.350 | 旺甫 | 11.0 | 4696.0 | 9 | 梧州南站-旺甫 |
| 0 | 2023-03-08 12:24:54.350 | 梧州南站 | 12 | 2023-03-08 13:40:12.350 | 旺甫 | 12.0 | 4518.0 | 12 | 梧州南站-旺甫 |
| 1 | 2023-03-08 15:31:44.350 | 梧州南站 | 12 | 2023-03-08 16:50:28.350 | 旺甫 | 12.0 | 4724.0 | 15 | 梧州南站-旺甫 |
| ... | ... | ... | ... | ... | ... | ... | ... | ... | ... |
| 0 | 2023-03-29 16:06:39.350 | 旺甫 | 1323 | 2023-03-29 17:29:14.350 | 梧州南站 | 1323.0 | 4955.0 | 16 | 旺甫-梧州南站 |
| 0 | 2023-03-30 12:20:16.350 | 旺甫 | 1327 | 2023-03-30 13:31:57.350 | 梧州南站 | 1327.0 | 4301.0 | 12 | 旺甫-梧州南站 |
| 0 | 2023-03-30 16:03:17.350 | 旺甫 | 1328 | 2023-03-30 17:28:23.350 | 梧州南站 | 1328.0 | 5106.0 | 16 | 旺甫-梧州南站 |
| 0 | 2023-03-31 12:14:50.350 | 旺甫 | 1330 | 2023-03-31 13:38:21.350 | 梧州南站 | 1330.0 | 5011.0 | 12 | 旺甫-梧州南站 |
| 0 | 2023-03-31 16:04:07.350 | 旺甫 | 1331 | 2023-03-31 17:43:40.350 | 梧州南站 | 1331.0 | 5973.0 | 16 | 旺甫-梧州南站 |
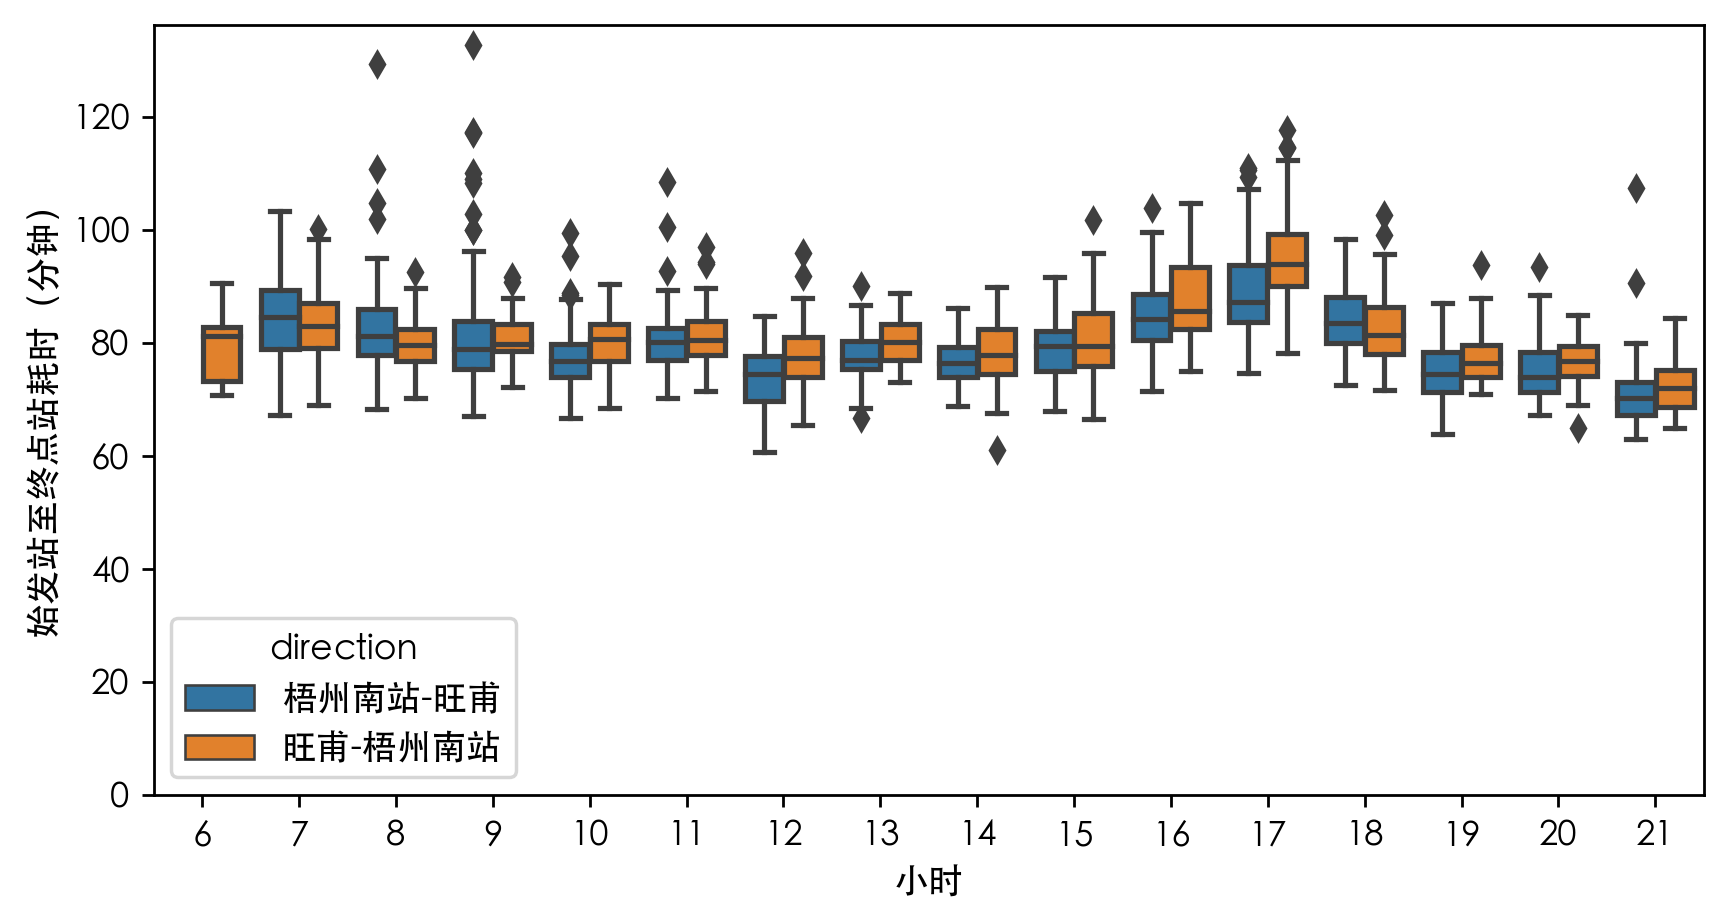
数据可视化
## 绘制耗时分布箱型图
import numpy as np
import matplotlib.pyplot as plt
import seaborn as sns
plt.rcParams['font.sans-serif']=['STHeiti']
plt.rcParams['font.serif'] = ['STHeiti']
plt.rcParams['axes.unicode_minus']=False
fig     = plt.figure(1,(8,4),dpi = 250)å
ax1      = plt.subplot(111)

sns.boxplot(x = 'shour',y = onewaytime['duration']/60,hue = 'direction',data = onewaytime)

plt.ylabel('始发站至终点站耗时(分钟)')
plt.xlabel('小时')
plt.ylim(0)
plt.show()
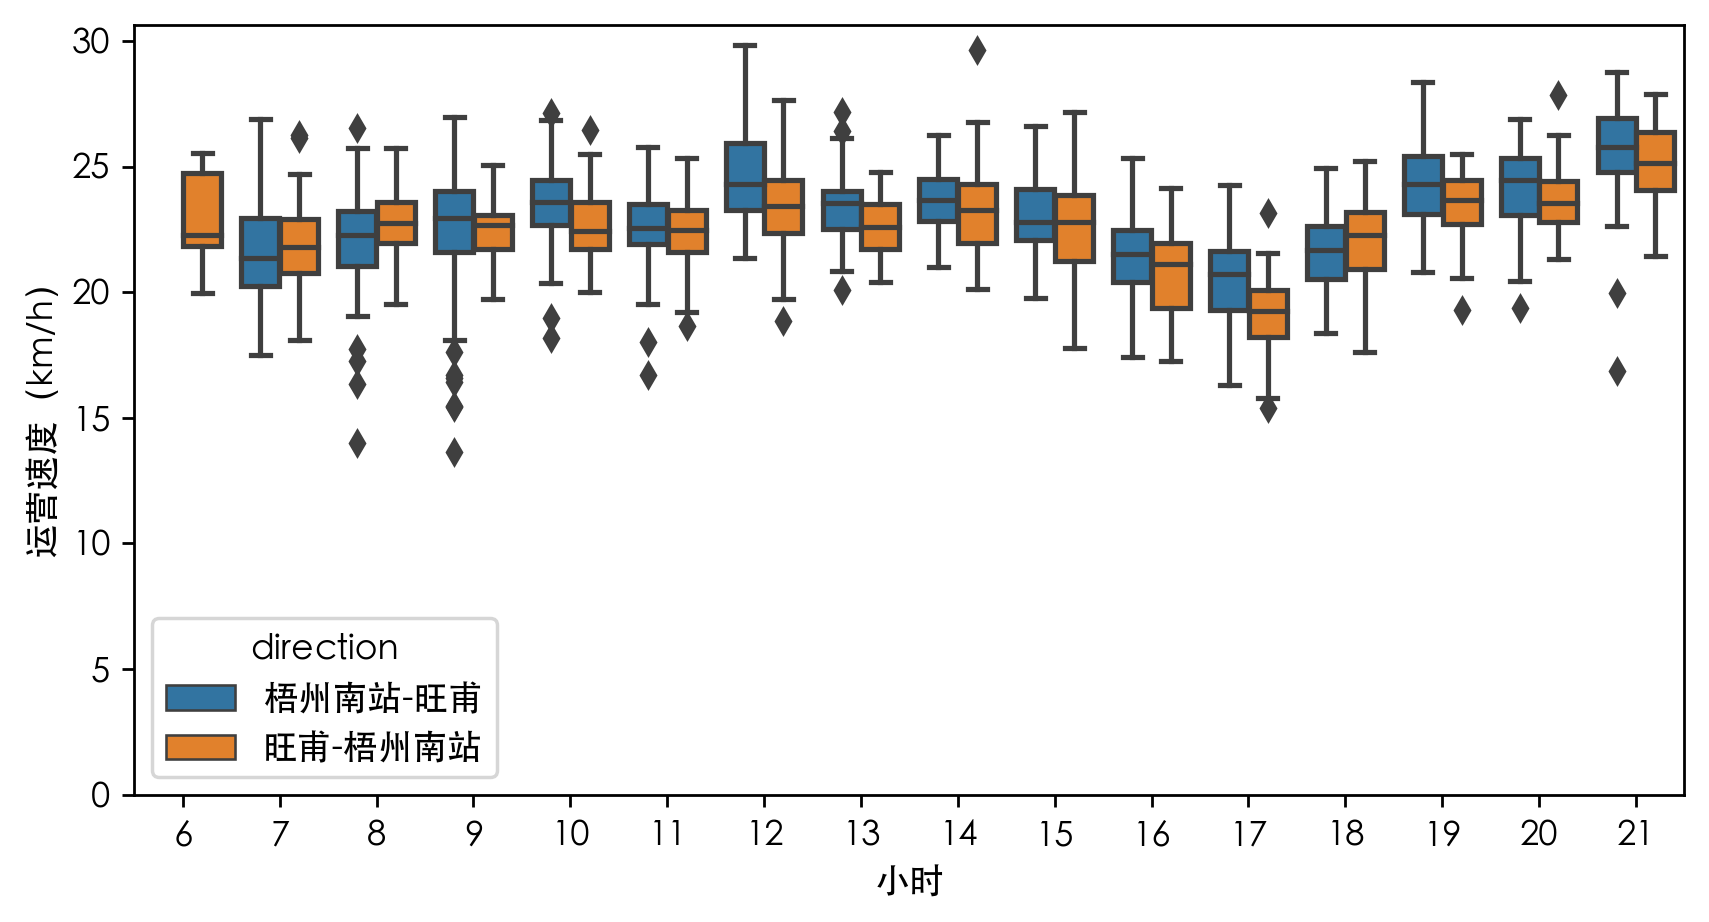
运营车速
#转换坐标系为投影坐标系,方便后面计算距离
line.crs = {'init':'epsg:4326'}
line_2416 = line.to_crs(epsg = 2416)
#公交线路数据里面的geometry
lineshp = line_2416['geometry'].iloc[0]
linename = line_2416['name'].iloc[0]
lineshp

#筛选去掉车速过快的
#车速单位转换为km/h
onewaytime['speed'] = (lineshp.length/onewaytime['duration'])*3.6
onewaytime = onewaytime[onewaytime['speed']<=60]
## 车速分布
import numpy as np
import matplotlib.pyplot as plt
import seaborn as sns
plt.rcParams['font.sans-serif']=['STHeiti']
plt.rcParams['font.serif'] = ['STHeiti']
plt.rcParams['axes.unicode_minus']=False
fig     = plt.figure(1,(8,4),dpi = 250)
ax1      = plt.subplot(111)
sns.boxplot(x = 'shour',y = 'speed',hue = 'direction',data = onewaytime)
plt.ylabel('运营速度(km/h)')
plt.xlabel('小时')
plt.ylim(0)
plt.show()
关于作者
黎摄文,现任职于梧州公交智慧公交部,从事公交调度系统开发、维护、研究工作多年。